Reporting is one of the most essential stages of any campaign — but only if you’re asking the right questions. Too often, we see reports that focus solely on “what happened?” without answering the questions “so what?” or “what’s next?”
The goal of reporting is to use the data you’ve collected to make decisions.
Data-driven reports should:
- Focus on KPIs. Use secondary metrics to support your narrative, but don’t lose sight of your most important goals.
- Help you understand the multichannel customer experience. Customers are using multiple channels to interact with your business, so your reports should help you parse out the impact of each channel.
- Include insights and recommendations. If something is performing well, how can you double down on that tactic? If you’re not hitting your KPIs, what do you need to change? Stakeholders should walk away from the report ready to make decisions.
At CBC, we create actionable, data-driven marketing and PR reports for our clients using one of our favorite tools, Google Data Studio.
What is Google Data Studio?
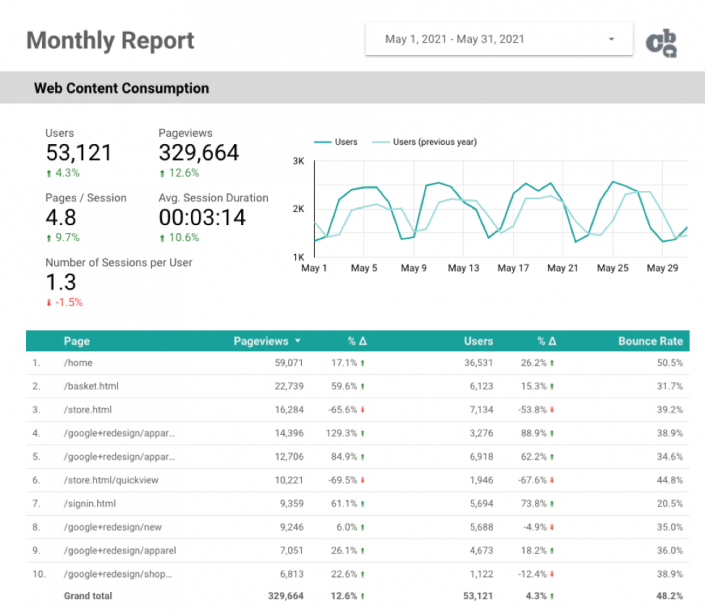
Google Data Studio is a free web-based software program that allows users to create customizable reports and dashboards. Users can pull data from a wide variety of data sources with little to no coding skills required. Visualization of the data is made easy through tables, graphs, and scorecards that can be filtered and customized to fit your specific needs.
Why use Google Data Studio?
-
Easily connect to your data
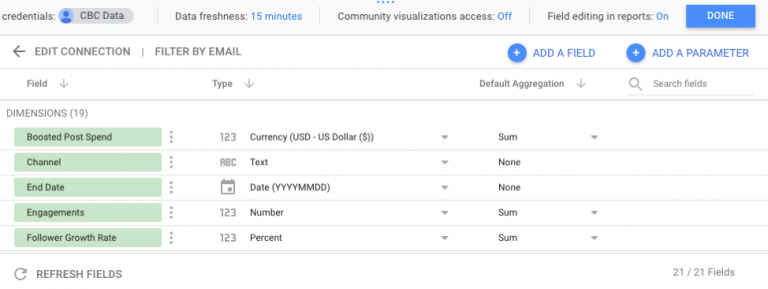
One of the top benefits of Google Data Studio is that it automatically pulls in data from your connected data sources. You can spend less time entering data and taking screenshots of dashboards, and more time analyzing the data.
-
Merge data sources
Google Data Studio allows you to take data sources and combine them to create cross-platform reporting. This is a powerful ability that allows you to take data from multiple systems to tell a story.
For example, you can take data from Google Search Console + data from Google Analytics + data from a CRM and connect those with URL as the merge key (as they all have URL in their data sets):
- Google Search Console – URL associated with search queries and search volume
- Google Analytics – Traffic associated with a URL
- CRM – Acquisition and sales data from a source URL
The merger of these 3 sources can tell you what terms generated traffic that ultimately drove sales.
-
Reusable templates
Create a template and use the date range controls to automatically populate your report with data from the timeframe you need. You can also easily duplicate the report, swap out data sources, and create new reports for other campaigns or clients.
-
Wide range of data sources
Google Data Studio integrates with a wealth of connectors, allowing you to centralize reports on various campaigns all in one place. Data Studio is highly compatible with Google data, so it’s easy to report on what users are doing on your website (Google Analytics), what users are searching for (Google Search Console), how your paid search campaigns are performing (Google Ads), and so on.
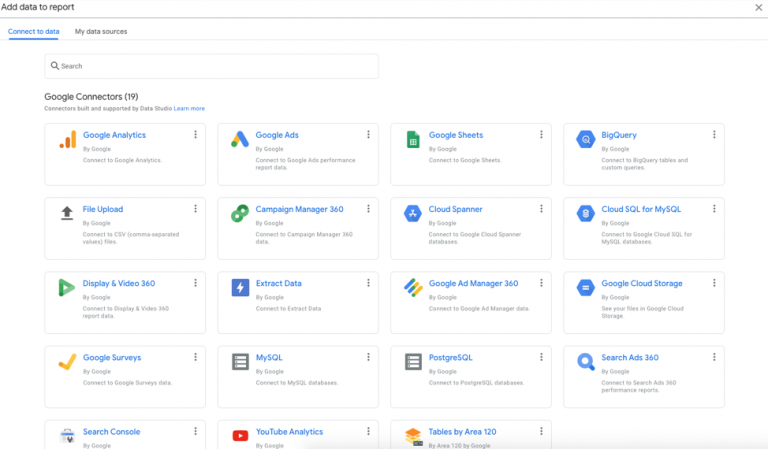
There are also a number of third-party connectors, as well as the option to build out your own data set in Google Sheets. This opens up the ability to bring in data from social media channels, marketing automation software, customer or membership management tools, PR coverage, or any other data set you have access to!
Bottom line: Google Data Studio streamlines the reporting process, moving the focus away from merely compiling data to using that data to tell a story. Done right, data-driven reports are a tool for proactively finding opportunities to improve performance and drive higher ROI.