Google is in the process of launching Google Analytics 4 (or GA4), which is the largest leap in how Google is presenting website traffic in years.
The old way of presenting data was very siloed. It looked at the Who / What / When / Where / and How of analytics. For example, here is the legacy hierarchy of how they categorized data:
- Audience = Who are your users?
- Acquisition = How did they find you?
- Behavior = Where did they interact with you?
- Conversion = What were the results?
- Date Selector = When did they come to your site?
In the classic version of Google Analytics, you had to define the events and engagements. You also had to define your funnel, and you were restricted to the limitations of the technology.
Ok, ok, what makes this nerd so excited about GA4?
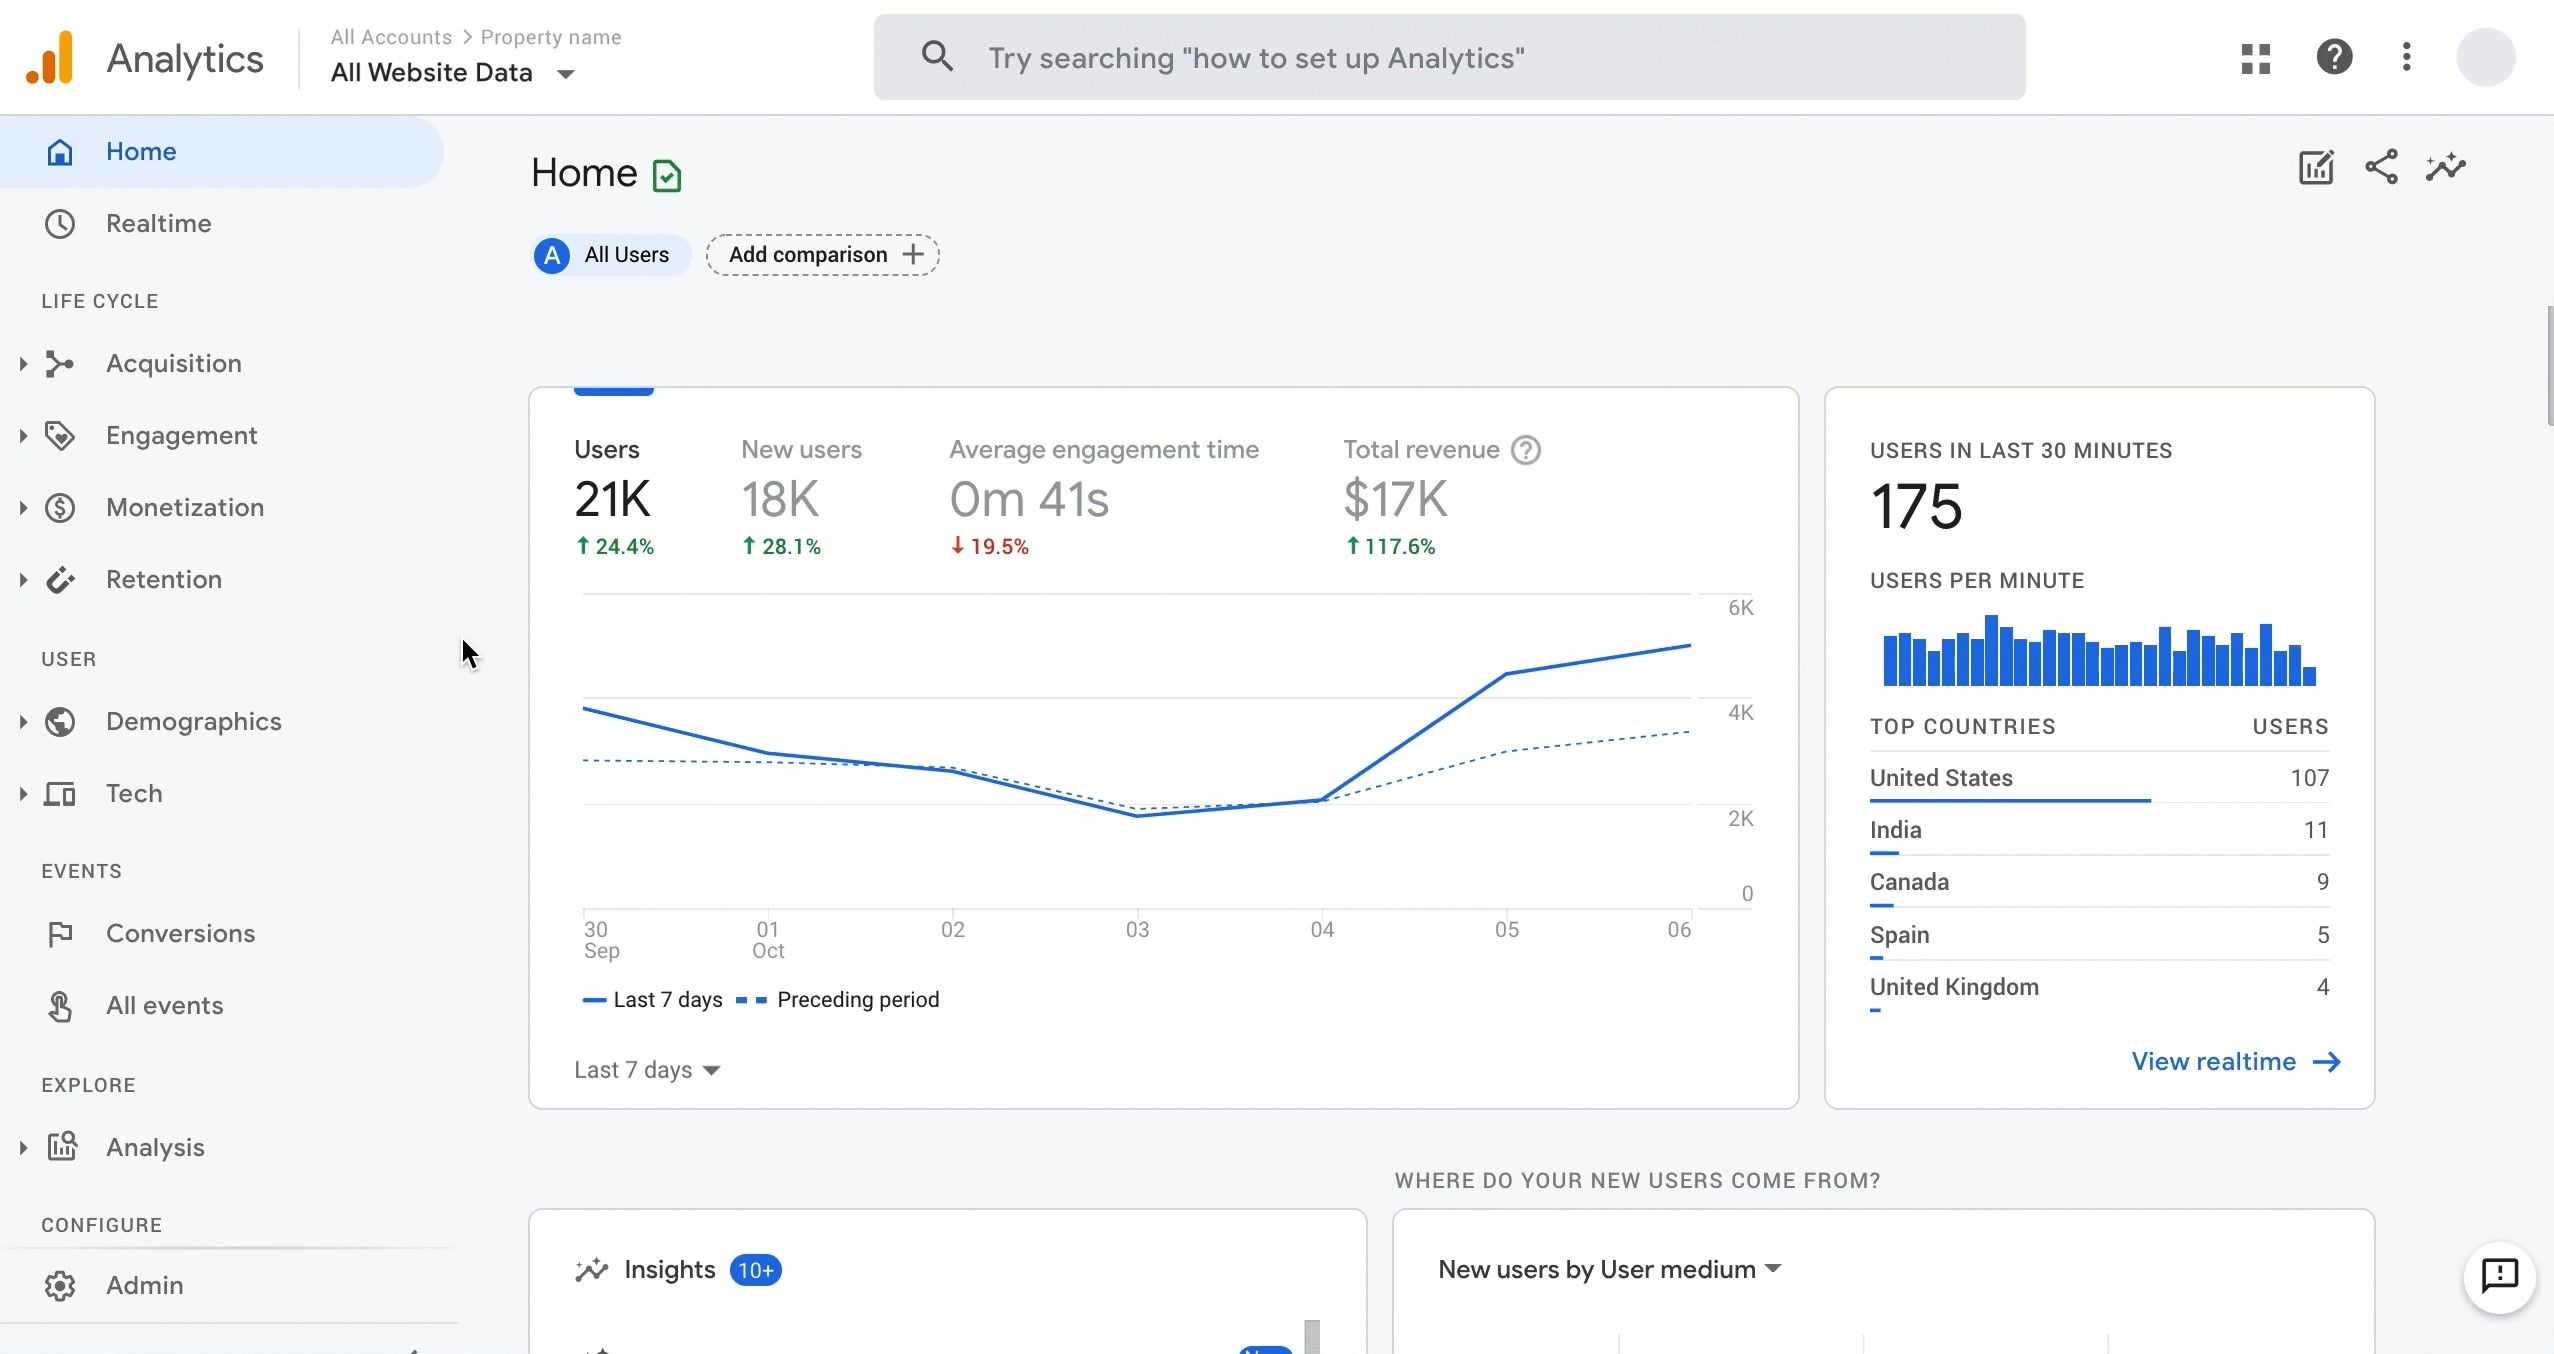
The new way takes a look at the cross-section of Who / What / When / Where / and How and centers it on the WHAT (aka the conversion). The new navigation looks like this:
Life Cycle
GA4 takes the entire funnel and places it into the Life Cycle section. In this section, you see the Who / What / When / Where / and How of the users, but Google expands upon it. You get to see how those steps interact with each other. This allows the new Google Analytics platform to get straight to the point of analytic reporting.

User
The User section of GA4 allows content creators to get an understanding of user demographics to inform the content creation process. It covers devices and locality to help you understand where your users are from and how they access your site.
Event
GA4 Events are a new, semi-automated approach to providing deeper insights into how users interact with your site. Although at this time Google has not yet defined what events will be standard, we have seen the following events already pre-configured without the need for Google Tag Manager or custom code:
- Clicks (Raw click counts)
- First Visits (How many users are visiting for the first time)
- Page Views (Raw page views)
- Scroll (How many people scrolled)
- Session Starts (How many times users began interacting with your site)
You can also mark events as conversions, allowing you to focus your reporting on the most important actions that users are taking on your site.
Explore
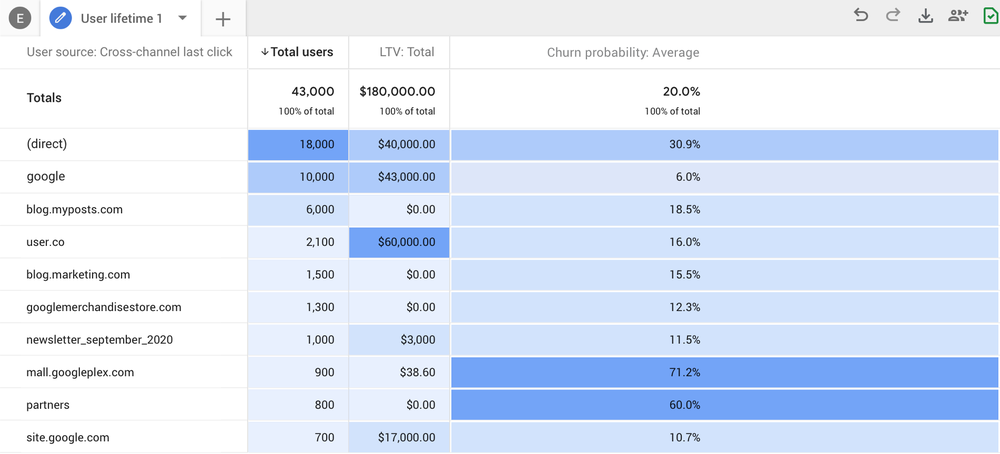
Here you will find nerdy analysis tools to throw fuel into your marketing and PR efforts. The Explore section provides a level of research analyst depth unmatched by anything in the classic Google Analytics reports. It is a collection of some familiar tools such as Path Analysis and new tools such as Exploration and Funnel Analysis.
Exploration is quickly becoming one of my most utilized tools, as it takes what I like about Google Analytics and merges it with the power of Google Data Studio. It effectively allows an analyst to build out custom tables on the fly to analyze data. No longer will we be stuck with stock reports and views.
What can GA4 mean for your business?
GA4 is the single largest evolution of Google Analytics. It will allow analysts easier access to the depth of data and allow business owners to quickly focus on the goals of their website with minimal configuration.
If you are interested in upgrading, you can follow the instructions provided by Google. Upgrading will not impact your current reports or data. Your new GA4 property will run in parallel to what you have now, so we recommend setting it up sooner rather than later so you can start collecting data and familiarizing yourself with the new user interface.
At CBC, we use GA4 to increase conversions as it provides us a more complete and integrated picture of how users interact with our clients’ websites. If you need a hand, contact us.


